
Observability
Three ways to watch a CUGA run — OpenLit, Langfuse, and the Activity tracker with cuga-viz.
Observability
CUGA can record a run three ways. Pick one, or combine them — they are independent.
| Option | What you get | Best for |
|---|---|---|
| OpenLit | OpenTelemetry traces, metrics, and logs for every LLM call | OTel / Grafana / Tempo pipelines |
| Langfuse | Nested traces in the Langfuse dashboard | LLM-ops dashboards and prompt debugging |
| Activity tracker + cuga-viz | Local trajectory files + a CUGA visualizer | Debugging a run on your machine — no extra account |
Architecture: These sit in the External services layer (OpenLit, Langfuse) or write local trajectory files the Activity tracker collects during the Orchestrator loop. See How CUGA works.
OpenLit
OpenLit instruments LLM SDKs and exports OpenTelemetry traces, metrics, and logs.
Install (optional extra):
uv sync --group observability
# or
pip install "cuga[observability]"
Enable:
[observability]
openlit = true
export OTEL_EXPORTER_OTLP_ENDPOINT="http://localhost:4318"OTEL_SERVICE_NAME and OTEL_RESOURCE_ATTRIBUTES work as usual.
Local stack: deployment/docker-compose/openlit/ in the cuga-agent repo (OTel Collector, Tempo, Prometheus, Grafana). Start it, point CUGA at the collector, run a task — you get per-call traces with model, tokens, latency, and cost.
Each LLM call records span timing, model/provider attributes, token counts, and latency histograms. Prompt/response content is off by default — see OpenLit docs.
CUGA instruments the providers it ships (OpenAI, LiteLLM, WatsonX). Custom providers need OpenLit's own instrumentation.
Langfuse
Langfuse traces the LangGraph loop: planner, tools, nested LLM calls, one tree per invoke() when tracing is on.
Enable:
[advanced_features]
langfuse_tracing = true
Set in .env (see the agent repo .env.example):
LANGFUSE_PUBLIC_KEY=...
LANGFUSE_SECRET_KEY=...
LANGFUSE_HOST=https://cloud.langfuse.com   # or your self-hosted URL
Open the Langfuse UI → Traces after a run. Independent of OpenLit — you can run both.
Activity tracker + cuga-viz
The Activity tracker records steps (plans, tool calls, observations, token usage) into local trajectory files. It is off by default. Turn it on before you expect cuga viz to show anything:
[advanced_features]
tracker_enabled = true
cuga-viz is the dashboard for those files.
After a few runs:
cuga vizOpen http://localhost:8988. You get a list of trajectories; click one for the overview, then the task id for step details.
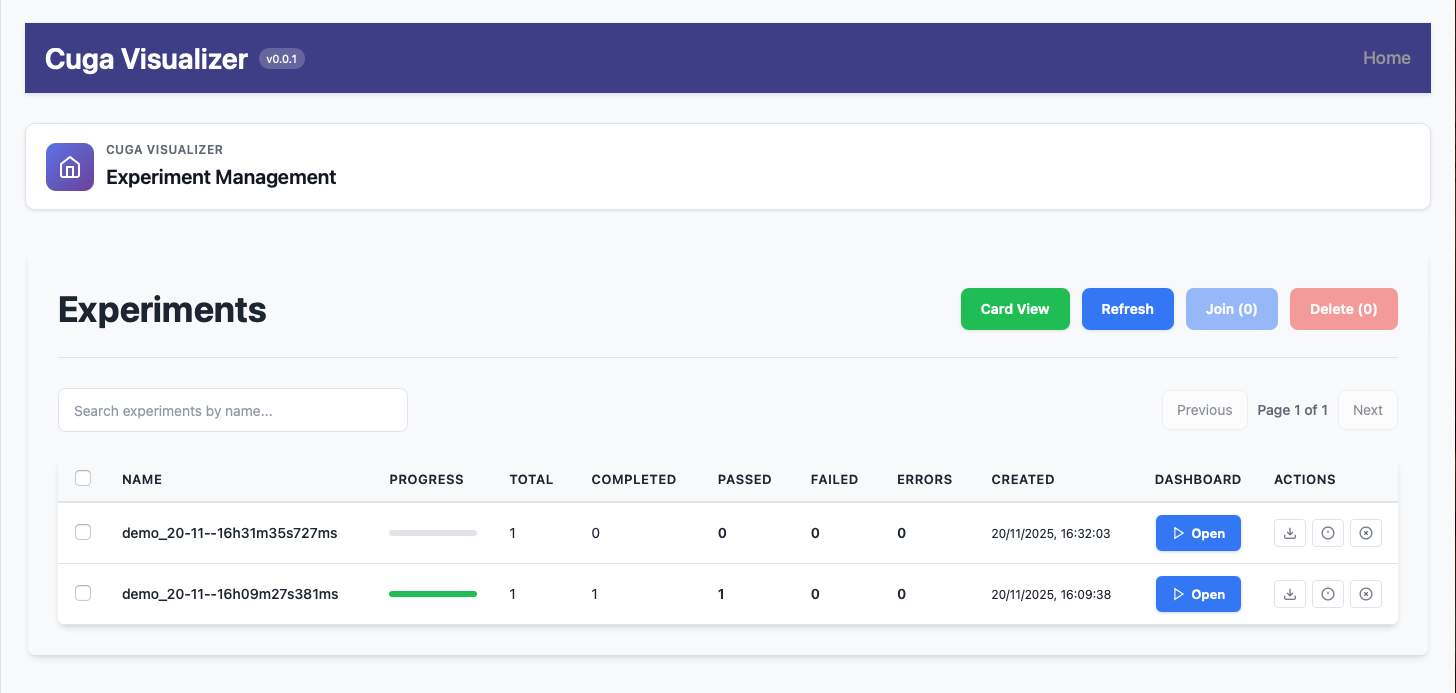

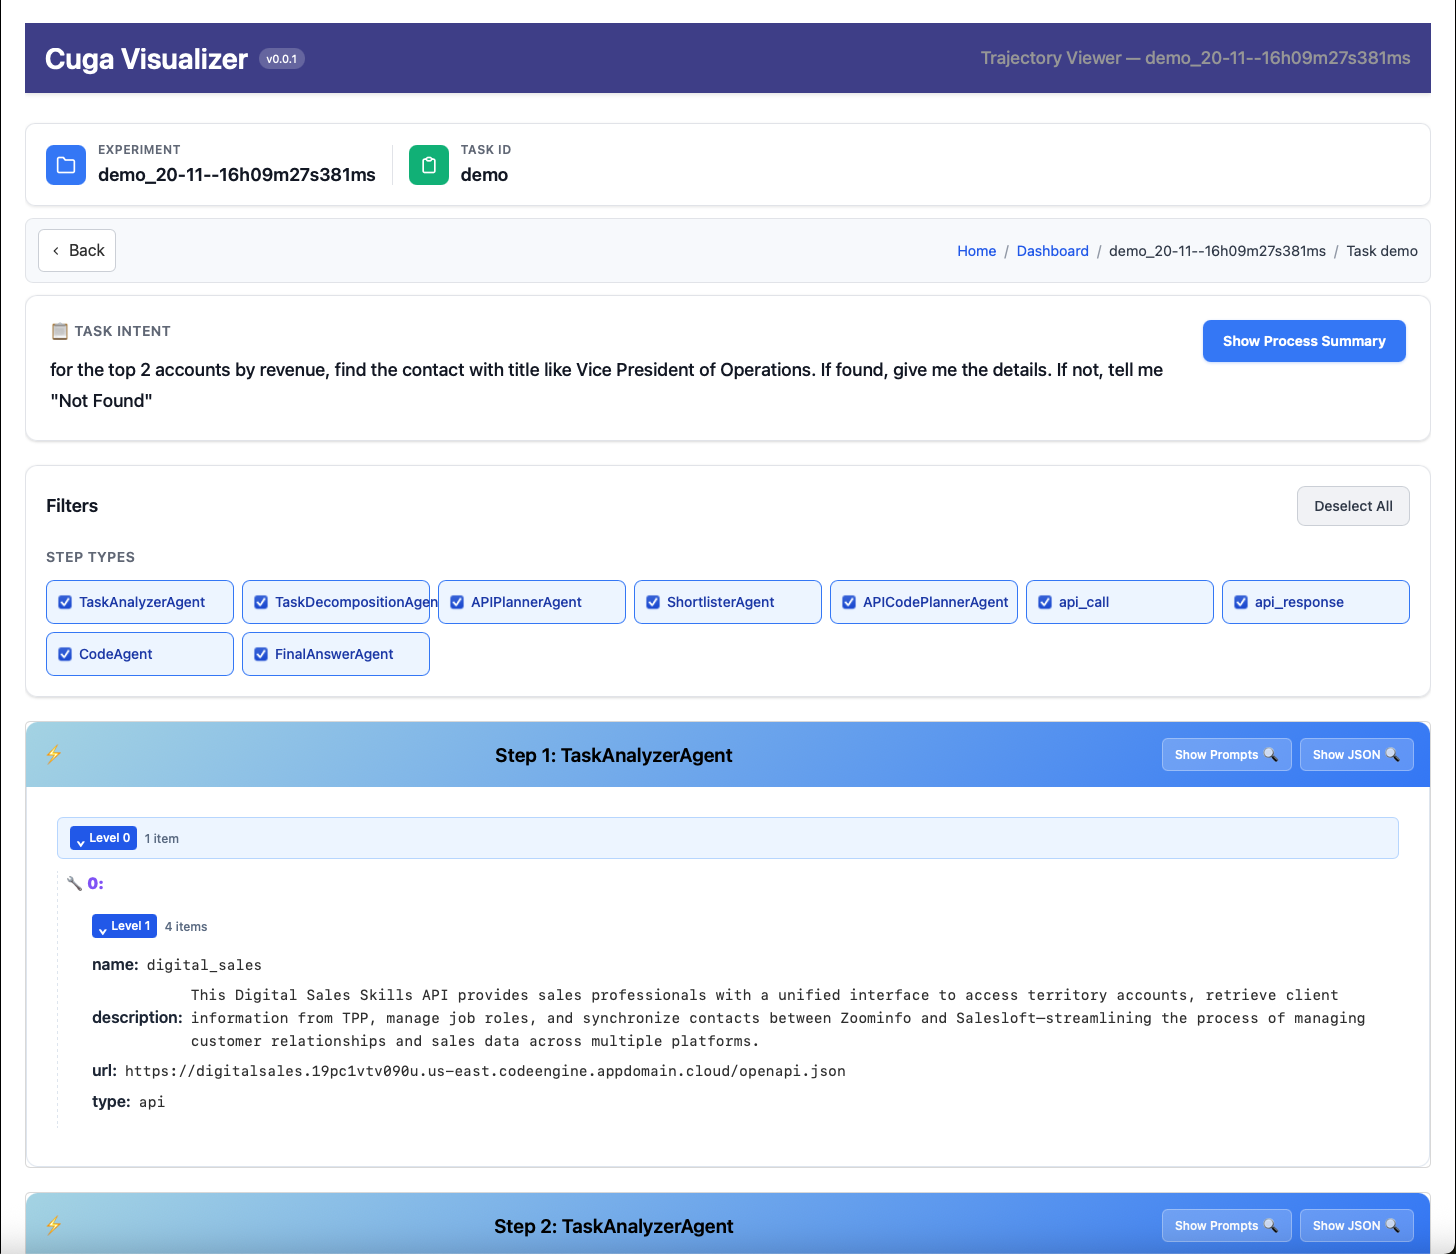
cuga viz uses the dev extra (uv run --group dev cuga-viz). No Langfuse account and no OTel collector required.
Related
- Settings reference — Observability
- Settings reference —
langfuse_tracing - Run receipt — tokens and timings on
InvokeResultwithout an external stack